Leader Phase · Initial CFO Cashflow Blueprint
Dr. JD Ide’s path from capacity to predictable profit.
Painless Chiropractic has the people and clinical capacity to grow. This blueprint installs the financial guardrails, role ownership, and weekly operating rhythm required to turn that capacity into consistent Waterline performance.
1 Executive CFO Snapshot
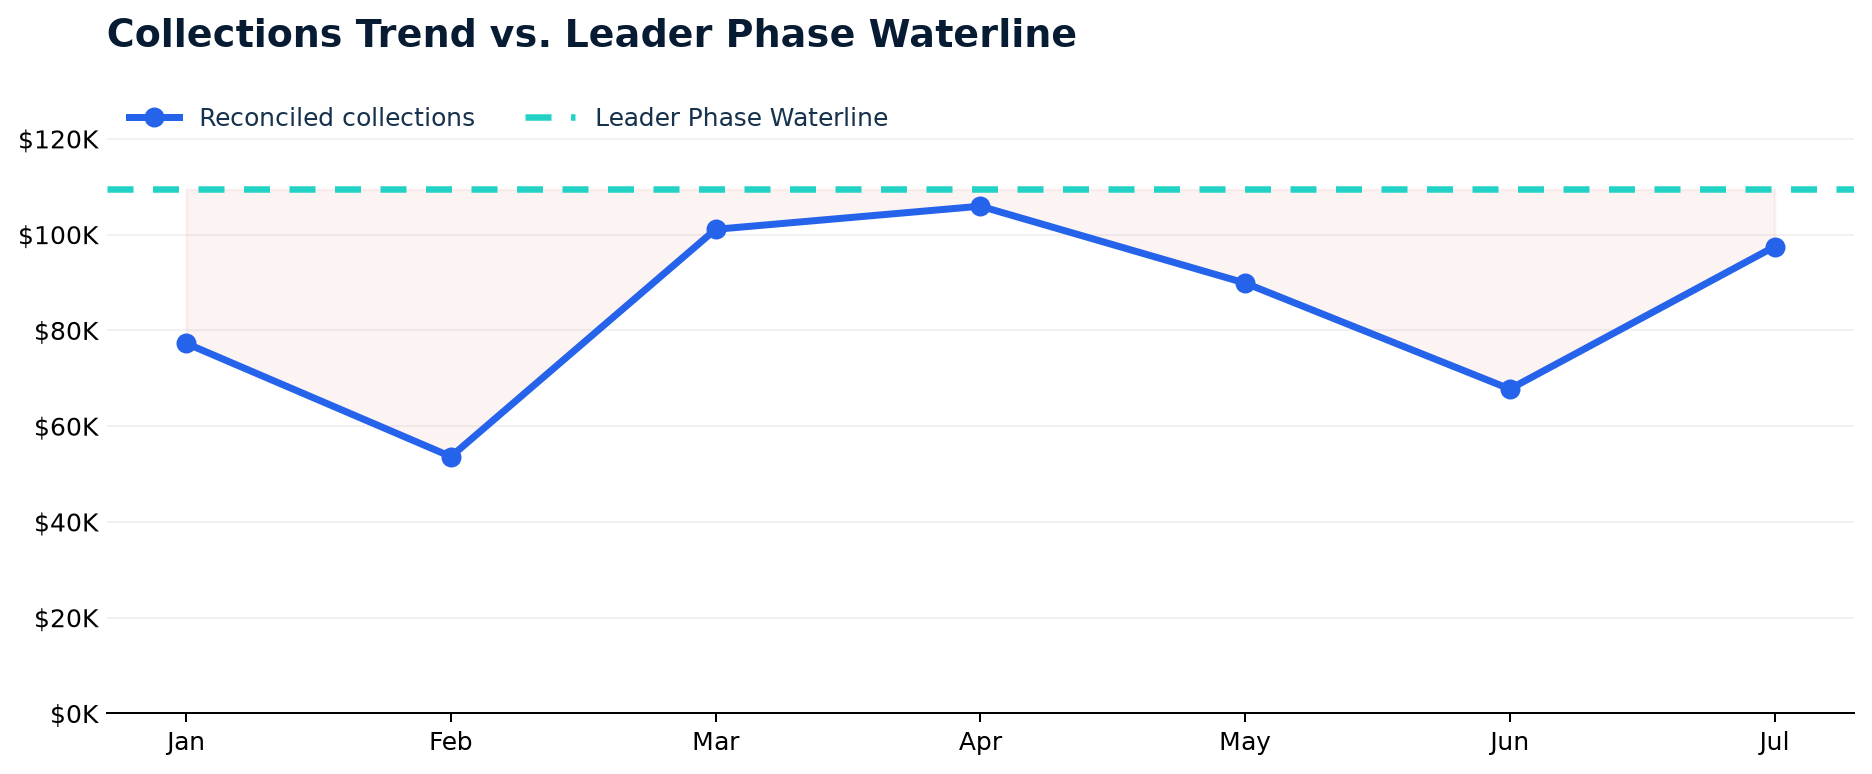
July shows the practice moving in the right direction: it generated $97,498.32 in total income and $15,363.06 in operating profit. The larger story, however, is consistency. Across the January–July reconciled P&Ls, the practice averaged only $938.18 in monthly operating profit before non-operating items. The model’s first priority is to make profit repeatable, not accidental.
This is not a broken practice. The July P&L proves the practice can produce profit. The constraint is a system: clear seat ownership, tighter expense guardrails, and a team scoreboard tied to one shared revenue goal.
2 Follow the Money: Total Income to Gross Profit
Gross profit is the money available to fund growth, labor, operating expenses, and profit after direct clinical goods and refunds. To avoid double-counting, the QuickBooks P&L’s Total Income already reflects the recorded refunds. The report therefore shows the operational flow as treatment sales less refunds, then less COGS.
| Reconciled monthly results | Jan–Jul average | July current | Waterline healthy month |
|---|---|---|---|
| Treatment sales (before refunds) | $86,876.83 | $97,498.32 | $109,468.98* |
| Less: refunds | ($2,137.90) | $0.00 | $0.00 |
| Total Income / Net Collections | $84,738.93 | $97,498.32 | $109,468.98 |
| Less: cost of goods sold | ($2,427.49) | ($212.30) | ($238.37) |
| Gross Profit available to fund the practice | $82,311.44 | $97,286.02 | $109,230.61 |
*The modeled Waterline uses July’s reported 0.22% COGS rate. This is a planning assumption, not a promise of future COGS; it should be recalibrated monthly as direct clinical costs and refunds change.
Waterline is the total revenue target. The $81,922.96 July operating-expense base is the current expense run rate—not the Waterline. A practice only clears Waterline when it has fully funded the operating model and generated the planned profit available for the Profit Waterfall.
3 Leader Phase Money Model
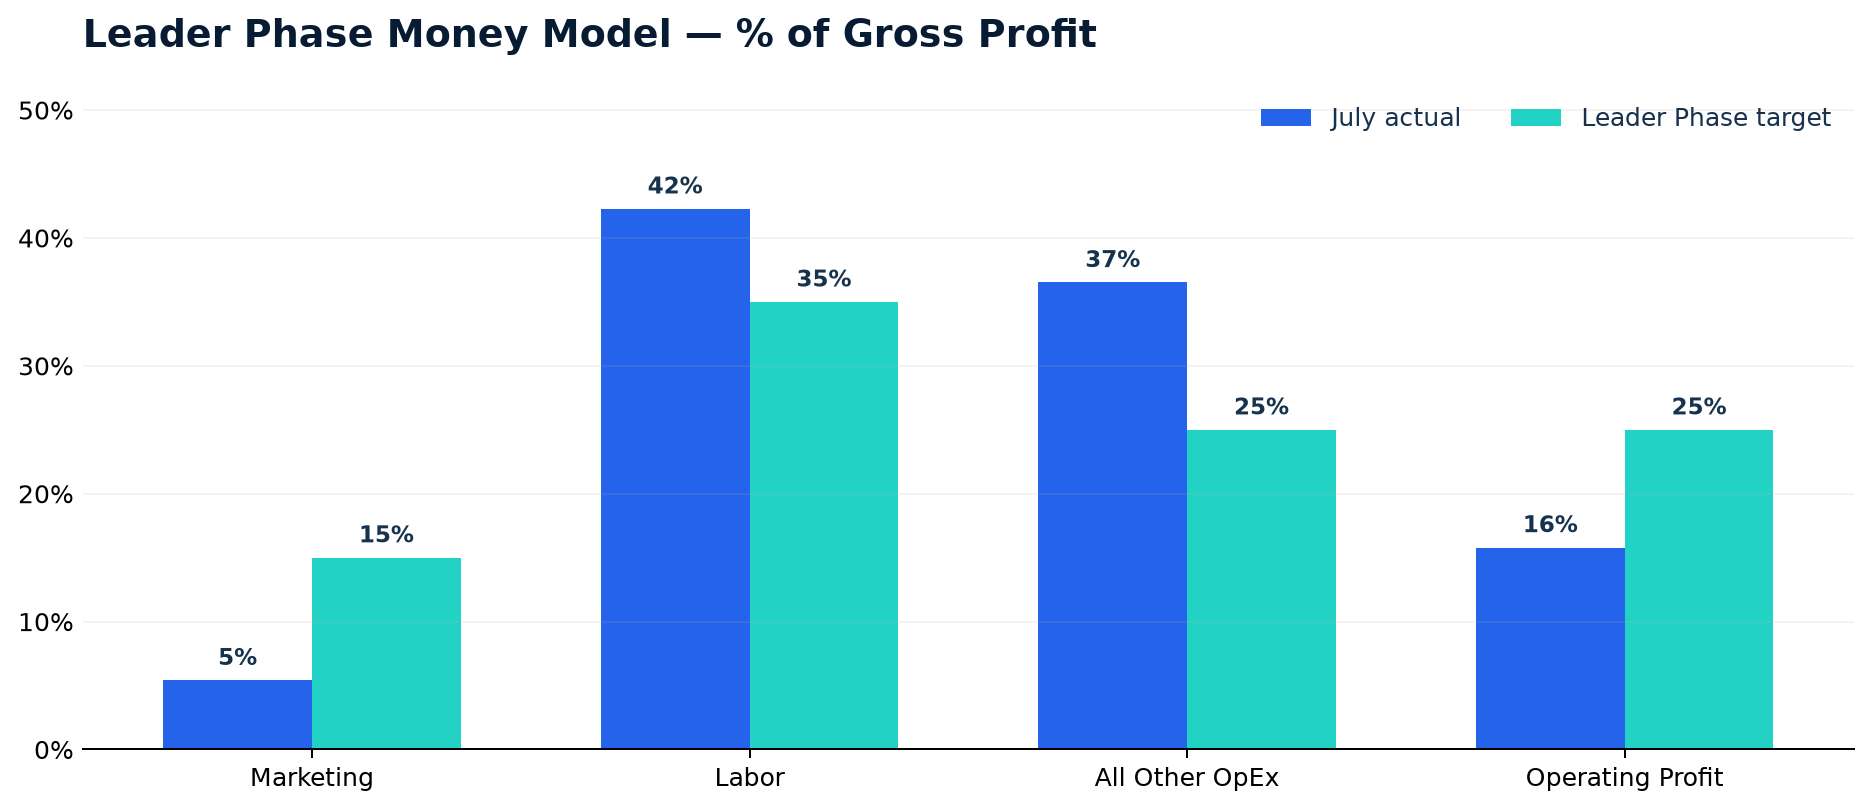
The model applies gross-profit guardrails: Marketing at or below 15%, Labor at or below 35%, All Other OpEx at or below 25%, and Operating Profit at or above 25%. These are capacity guardrails, not a directive to spend every dollar of each budget. Marketing should only scale when conversion quality is visible in the scorecard.
| Gross-profit funding bucket | July actual | July % GP | Leader guardrail | Target $ at July GP | Variance |
|---|---|---|---|---|---|
| Marketing | $5,262.83 | 5.4% | ≤ 15.0% | $14,592.90 | $9,330.07 below ceiling |
| Labor | $41,130.26 | 42.3% | ≤ 35.0% | $34,050.11 | $7,080.15 over |
| All Other OpEx | $35,529.87 | 36.5% | ≤ 25.0% | $24,321.51 | $11,208.37 over |
| Operating Profit | $15,363.06 | 15.8% | ≥ 25.0% | $24,321.51 | $8,958.45 below target |
What requires immediate attention
July all-other OpEx includes $10,128.75 in Legal & Professional Fees. Confirm whether this is a recurring operating cost, project-based professional expense, or a classification issue before making it part of a permanent budget. Other recurring average OpEx lines to deliberately manage include rent ($7,688/month), maintenance ($3,896/month), training & education ($2,767/month), software ($2,638/month), and office utilities ($2,342/month).
What not to do
Do not treat the $16,384.59 healthy-month marketing capacity as a spending target. First prove lead-to-appointment, show, start, and collection conversion by source. Then make one disciplined scaling decision from facts rather than adding broad spend to a blurred operating model.
4 The New Waterline & Healthy-Month Vision
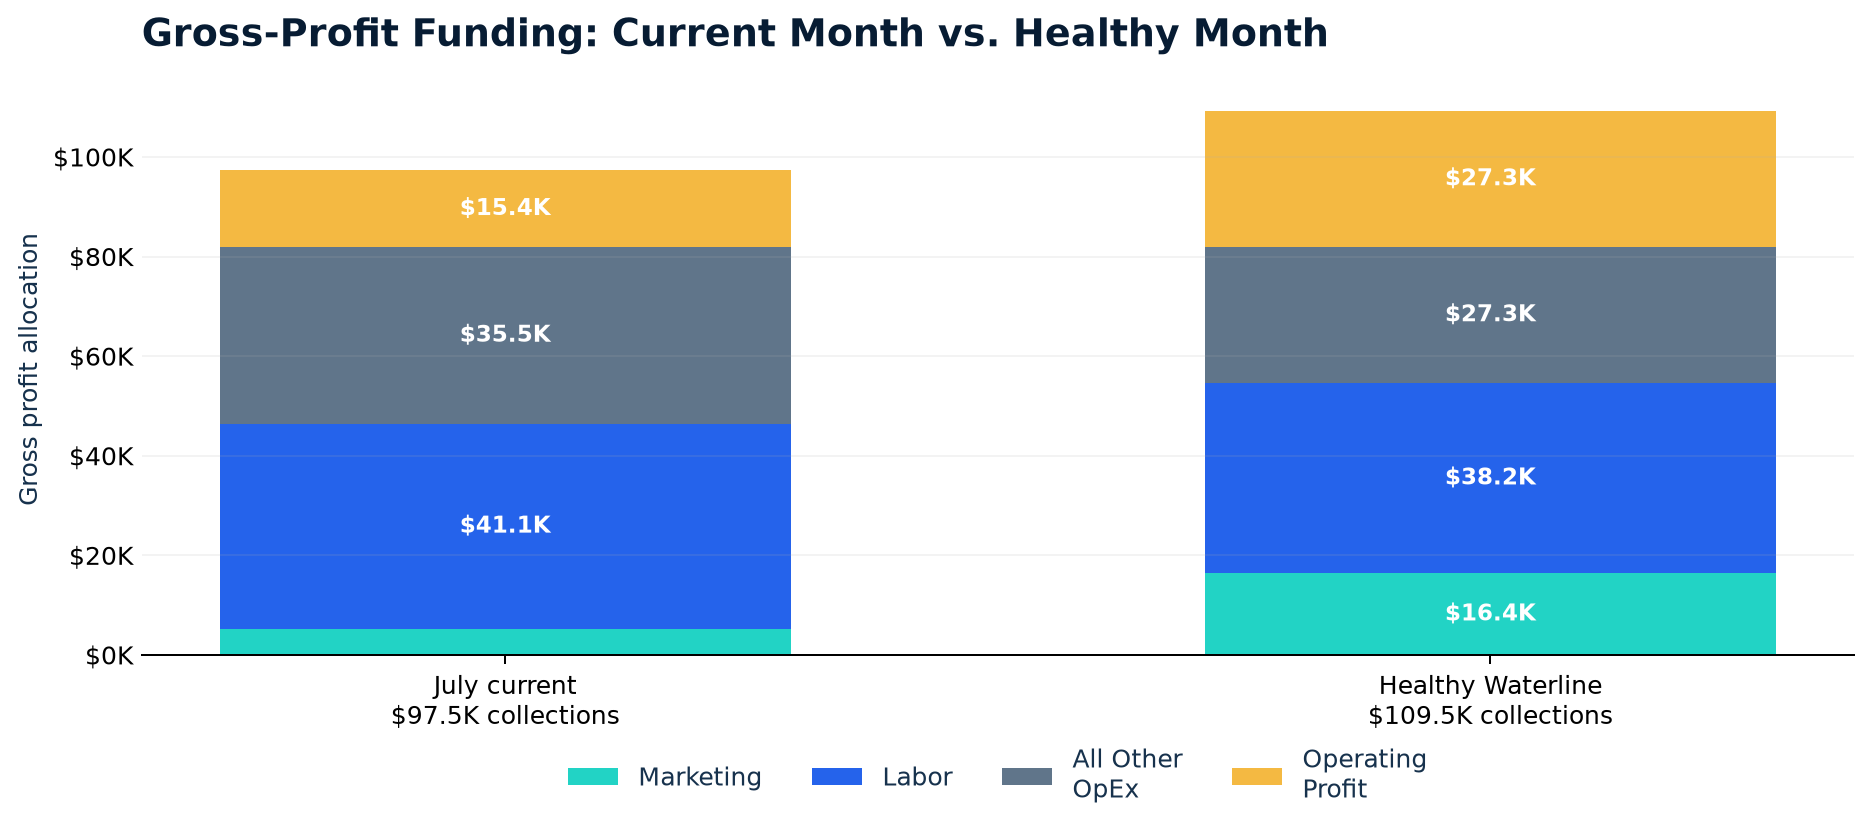
At the current expense run rate, the practice needs $109,468.98 in monthly collections to fund a Leader Phase operating model and retain 25% of gross profit as operating profit. This is $11,970.66 above July, or 12.3% more collections. The key is not simply more revenue; it is more revenue entering a model with named ownership and expense guardrails.
| Healthy-month Waterline funding plan | Budget | % of gross profit | Meaning |
|---|---|---|---|
| Marketing capacity | $16,384.59 | 15.0% | Maximum disciplined capacity after conversion evidence exists. |
| Labor | $38,230.71 | 35.0% | Requires role ownership and labor redesign; $2,899.55 below July’s labor expense. |
| All Other OpEx | $27,307.65 | 25.0% | Requires recurring-cost discipline and one-off expense review. |
| Operating profit | $27,307.65 | 25.0% | Funds the Owner / Tax / Growth / Team Bonus Profit Waterfall. |
5 Profit Waterfall: Current vs. Cleared
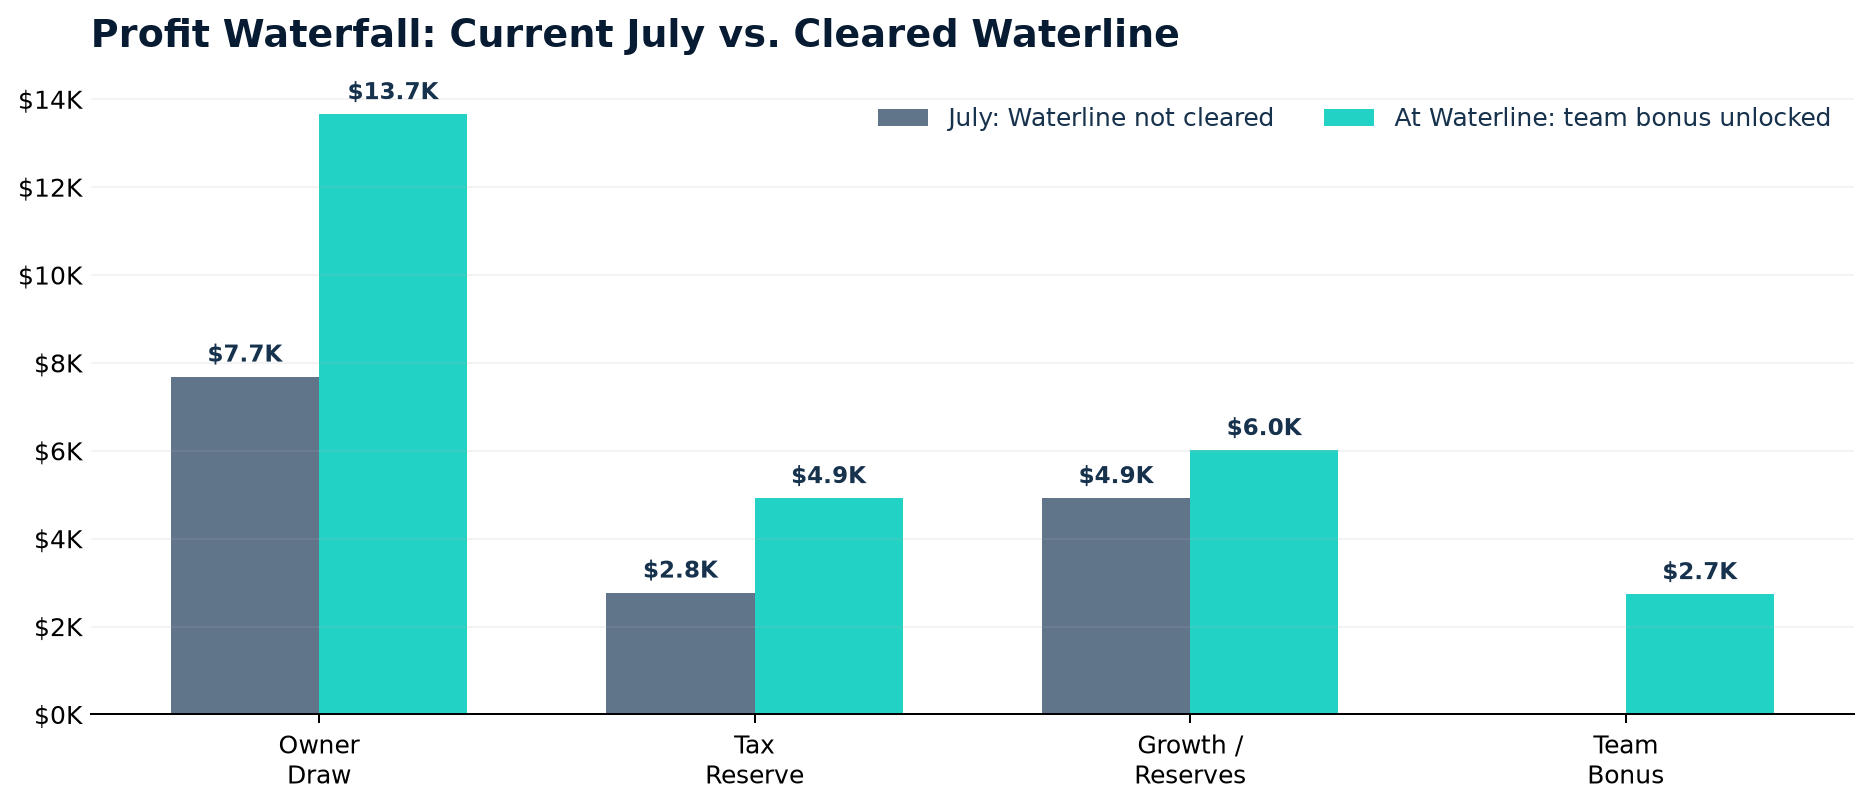
The Profit Waterfall distributes operating profit after Waterline is cleared: 50% owner draw, 18% tax reserve, 22% growth account, and 10% team bonus. Because July does not clear the new Waterline, its team-bonus portion remains locked and is modeled inside growth/reserves. This is an illustrative management allocation—not confirmation that cash is already held in separate accounts.
| Profit allocation | July model — Waterline not cleared | Waterline model — bonus unlocked |
|---|---|---|
| Owner draw | $7,681.53 | $13,653.83 |
| Tax reserve | $2,765.35 | $4,915.38 |
| Growth / reserves | $4,916.18 (32% includes locked bonus) | $6,007.68 |
| Team bonus | $0.00 (locked) | $2,730.77 |
6 New-Patient Acquisition Cost & Lifetime Value
Acquisition economics should guide marketing decisions, but the current records support only a limited July proxy—not a verified source-level NPAC or lifetime-value calculation. The BlueIQ snapshot combines 38 new and reactivated patients, while the QuickBooks P&L reports $5,262.83 of July marketing expense without paid spend by channel. Reactivations are valuable, but they are not newly acquired patients and should not be used as the permanent NPAC denominator.
| Metric | Current reading | How to use it |
|---|---|---|
| Blended July marketing cost per reported new/reactivated patient | $138.50 | A directional proxy only: $5,262.83 July marketing expense ÷ 38 reported new/reactivated patients. It is not a true NPAC because both the numerator and denominator are blended. |
| Verified new-patient acquisition cost | Not yet measurable | Use paid acquisition spend attributable to a source ÷ completed new patients from that same source and period. Keep reactivations separate. |
| Lifetime value (LTV) | Not yet measurable | Requires collected revenue by a defined new-patient cohort, completed starts, refunds, and a fixed horizon. The supplied data has no cohort revenue, completed-start count, or average-visit record from which to calculate LTV. |
Beginning with the next monthly close, track each source from paid spend → lead → scheduled appointment → completed new-patient appointment → start → 90-day, 180-day, and 12-month collected revenue. Define one “acquired patient” denominator and preserve it consistently. For the Leader Phase, compare NPAC to LTV only after LTV is measured; the Driven benchmark is NPAC at or below 5% of LTV. This turns marketing from an expense line into a managed investment.
Collections per July appointment ($76.59 = $97,498.32 ÷ 1,273 appointments) is an operational utilization measure, not patient lifetime value. Google produced 11 and Internet 5 of the 38 reported new/reactivated patients in the July BlueIQ snapshot; neither count can yet be used to calculate channel CAC because source-level spend and completed-new-patient data were not supplied.
7 Team Wiring & the Right Seats
Dr. JD Ide shared that the three CAs and two DCs are working where needed, but clear roles fell apart after his wife—who had been carrying the former micromanager role—left both the relationship and the practice. This was a significant personal and operational transition. The answer is not to recreate dependency on one person; it is to build a CEO-supported Integrator, System Drivers, and Sprint Leads who use the same scorecard.
“Everyone helps” is the emergency standard. Named ownership is the operating standard. Each major system needs one primary owner, one measurable KPI, and one defined handoff.
Own Waterline, quarterly priorities, strategic growth decisions, clinical standards, and leadership development—not daily task chasing.
Test for 90 days as Operations Lead: daily huddle, scorecard preparation, task follow-up, and administrative handoffs, subject to capacity and results.
Test ownership of new-patient experience, front-end communication, and care-plan support metrics.
Test ownership of recare/reactivation outreach and patient-continuity follow-up with clear documentation standards.
Test a time-bound clinical sprint: completed exams to recommendations, care-plan starts, or a similar measurable conversion bottleneck.
Test a time-bound sprint around re-exams, visit compliance, patient progression, or capacity utilization.
These recommendations use the supplied 16Personalities profiles as working-style hypotheses only. They must be validated against demonstrated skill, capacity, performance, authority, and willingness; they should not be used as a hiring or clinical assessment.
Do not add a net-new full-time office-manager payroll commitment today. July labor is $41,130.26 (42.3% of gross profit), versus the Leader Phase guardrail of 35.0%. At the proposed Waterline, the model permits $38,230.71 in labor—still $2,899.55 below July’s labor. Rebuild ownership first; use an internal 90-day Interim Integrator test or a tightly scoped fractional operations resource if needed. Reconsider a permanent full-time hire only after Waterline performance and labor guardrails are sustained.
8 The Driven Operating System
The Driven Operating System creates the shared language required for the team to stop reacting and start executing. It does not add bureaucracy. It makes the existing work visible, owned, and reviewable.
BlueIQ Scorecard
Use one weekly financial-and-production screen: collections vs. $109,468.98 Waterline, refunds, COGS, labor, OpEx, new-patient source, patient opportunity queues, clinical conversion, and current sprint performance.
The Cadence
1. Annual OKRs → 2. Quarterly CKPI + Pryme Mover → 3. Monthly Sprints → 4. Weekly Team Meeting + Execution. This rhythm ties every role to the same financial destination.
System Drivers
Name a single quarterly owner for each system. System Drivers protect the system’s health; Sprint Leads can change by sprint to move the current priority forward.
Profit Waterfall
Make the financial future visible. The team bonus is a reward for clearing Waterline within the defined operating model—not a promise detached from profitability.
Pearson’s Law
“When performance is measured, performance improves. When performance is measured and reported back, the rate of improvement accelerates.”
First Quarterly Focus
| Quarterly CKPI | Pryme Mover | Leading indicators | System Driver |
|---|---|---|---|
| Monthly collections at or above $109,468.98 Waterline | Install a role-owned patient-growth and financial-accountability system. | Daily opportunity-list outreach; completed exams; recommendations; starts; recare scheduled; collections; labor and OpEx vs. gross-profit budgets. | Dr. JD Ide sponsors; Interim Integrator orchestrates; named CA/DC owners lead their individual system drivers. |
9 90-Day Implementation Plan
1–30
Stabilize the Financial Control Room
Install the weekly Waterline scorecard. Reconcile BlueIQ operating collections to the QuickBooks close. Audit volatile expenses—especially July Legal & Professional Fees—to separate recurring, project, and misclassified costs. Freeze new permanent payroll commitments. Document one primary owner for new-patient flow, patient progression, reactivation, clinical capacity, and meeting execution.
31–60
Install Cadence and Win the First Sprints
Run daily huddles and weekly team meetings from the scorecard. Work the BlueIQ no-recare-scheduled, due-for-recare, and going-inactive opportunities every day. Give the associate DCs distinct clinical conversion/capacity sprints. Track source quality from lead to appointment to start to collections before making marketing scaling decisions.
61–90
Optimize, Reward, and Build the Next Layer
Compare actual spending against gross-profit budgets. Clear the Waterline and fund the Profit Waterfall according to policy. Evaluate the Interim Integrator’s authority, capacity, and results. Complete the documented org chart, scorecards, handoffs, and the next quarterly CKPI + Pryme Mover.
10 The Leader-Phase Roadmap
The Chiropractic CEO framework describes five levels: Promoter — Freedom to Become Known; Operator — Freedom of Money; Leader — Freedom of Time; High Performer — Freedom of Purpose; and Expander — Freedom of Wealth. Dr. JD Ide is in the Leader Phase. The next freedom is earned when the practice can reliably turn patient demand into collections with a team that knows the numbers, owns its systems, and meets without waiting for the CEO to rescue execution.
When Painless Chiropractic consistently clears Waterline with the right seats, scorecards, and cadence, Dr. JD Ide can lead at the level the practice needs: less time filling operational gaps, more time building people, patient impact, and a durable practice that creates the Freedom of Time—and then the Freedom of Purpose.